Trend in Forex and the Stock Market
In the Forex and stock markets, there are only two states of price movement — a trend or a sideways market. It is very important for a trader to be able to identify which state the market is in. A trader should know how to trade both in a trending market and in a sideways market.Contents:


What Is a Trend
A trend is a price movement that has a direction — either upwards or downwards. A trend can be either uptrend (bullish) or downtrend (bearish).In trading, there is a popular saying: "The trend is your friend." This means that when you trade with the trend, your "friend" will generally help you move into profit, no matter where you enter the trade. However, in modern markets, it is not always so straightforward, and your "friend" may not always be a friend.
Types of Trends
There are several types of trends, which are classified by direction (uptrend, downtrend), by strength (weak, strong), and by time frame (short-term, medium-term, long-term).A Bullish Trend
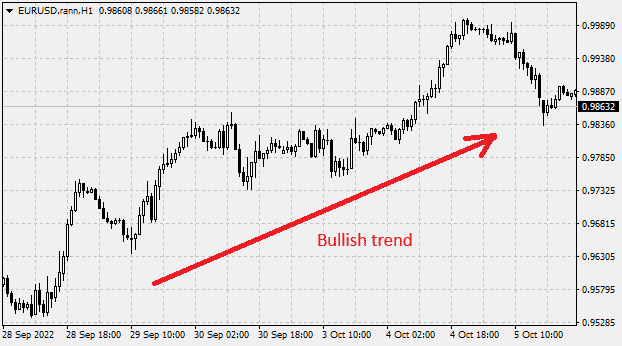
A bullish (upward, rising) trend is when the price has a steady upward movement — in other words, it is increasing.
A Bearish Trend
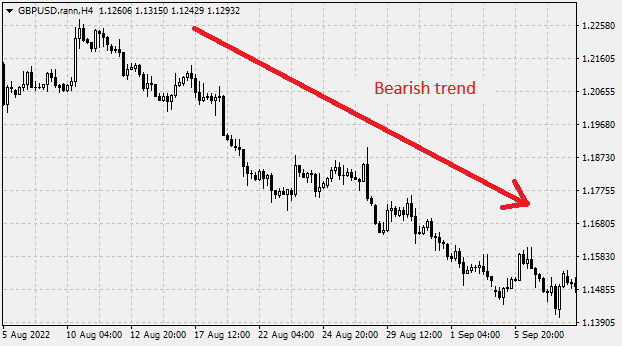
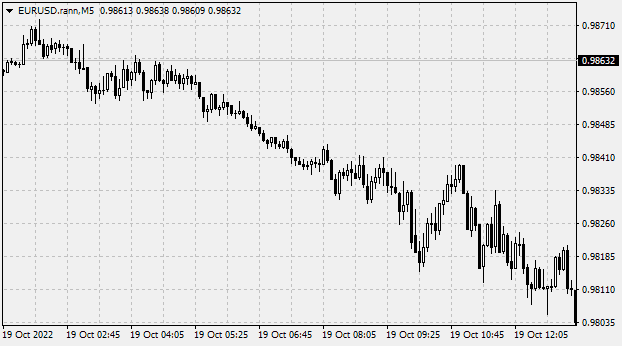
A bearish (downward, falling) trend is when the price has a steady downward movement — in other words, it is decreasing.
A Weak Trend
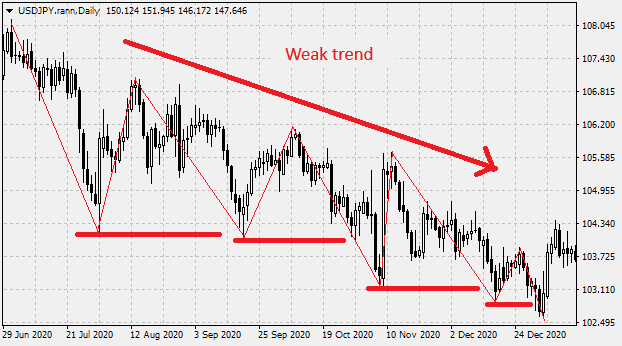
A weak trend is characterized by the price covering a relatively small distance up or down over a given period of time. Visually, on a chart, a weak trend often has deep pullbacks, and after exiting them, the price moves only a short distance. Often, a weak trend can be a correction of a longer-term trend.
A Strong Trend
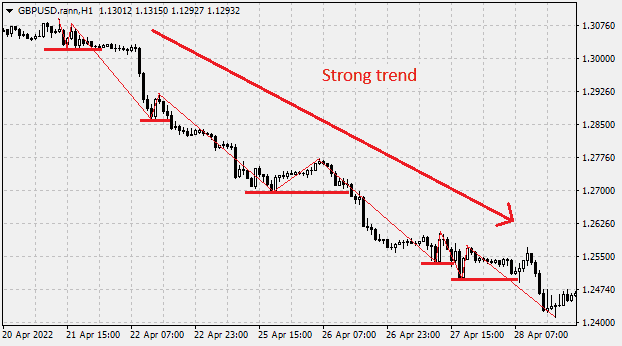
A strong trend is characterized by the price covering a relatively large distance over a given period of time. Visually, on a chart, a strong trend usually has shallow pullbacks, and after exiting them, the price continues to move a significant distance in the trend direction. Strong trends often demonstrate a clear and sustained movement and can last for extended periods.
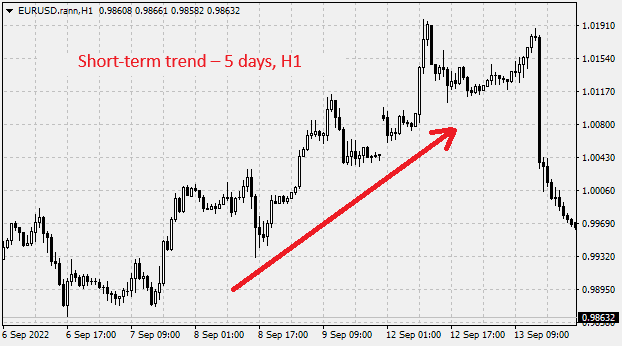
A Short-Term Trend
A short-term trend usually occurs within a period of one to several weeks. It is identified on timeframes from M5 to H1. A short-term trend can be intraday or within a single session (Asian, European, or American session). It also includes intraday trends on ticks and 1-minute charts, which are mainly traded by scalpers.
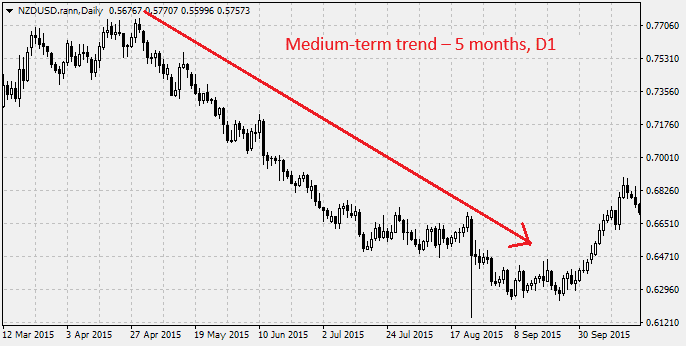
A Medium-Term Trend
A medium-term trend lasts up to several months (approximately up to six months). This type of trend is identified on timeframes from H4 to D1.
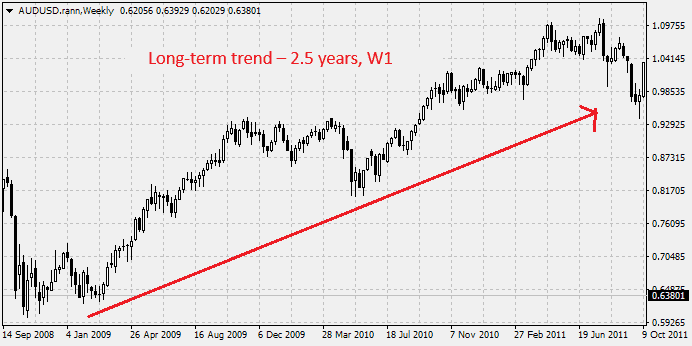
A Long-Term Trend
A long-term trend lasts approximately up to several years (about 3–5 years). It can be identified on timeframes from D1 to W1.
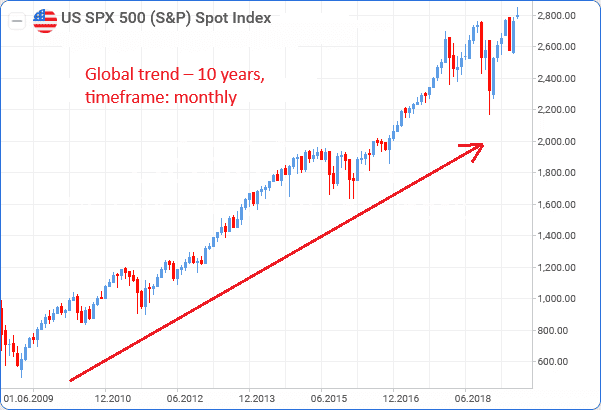
A Global Trend
A global trend is a very stable and long-lasting directional movement of the price, which can last for decades.
All of the above definitions of trend duration are quite approximate.
How to Identify a Trend
A trend can be identified in several ways:- Visually
- Using trendlines
- Using indicators
- Using other methods
Visual Identification of a Trend
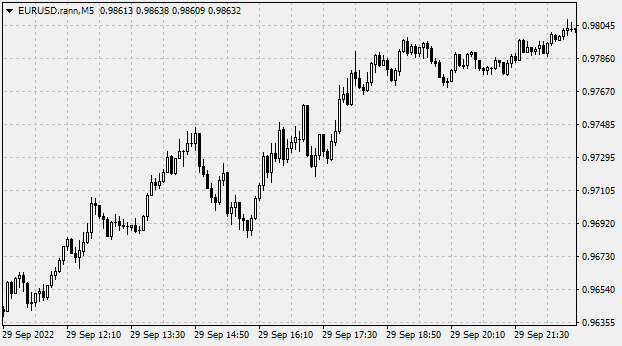
To visually identify a trend, no additional tools are required — you simply look at the chart and see whether the price is moving up or down.
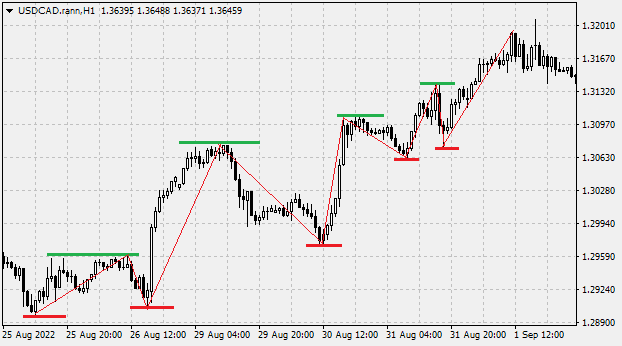
You can also apply Charles Dow’s theory, which states that in an uptrend, each successive high and correction should be higher than the previous high and the previous correction. For a downtrend, the opposite is true — each successive low and correction should be lower than the previous low and the previous correction.
Identifying a Trend Using Trendlines
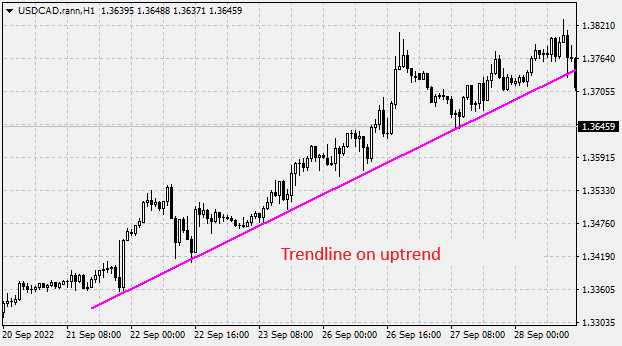
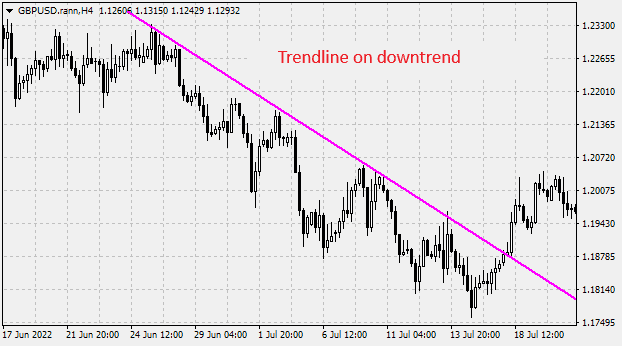
We have already covered trendlines earlier in this article. Here, we will briefly recap: the uptrend line is drawn on the lower boundary of the trend, and the downtrend line is drawn on the upper boundary. Accordingly, the trend remains valid as long as the line is not broken and the price does not close beyond it on the opposite side.
Identifying a Trend Using Indicators
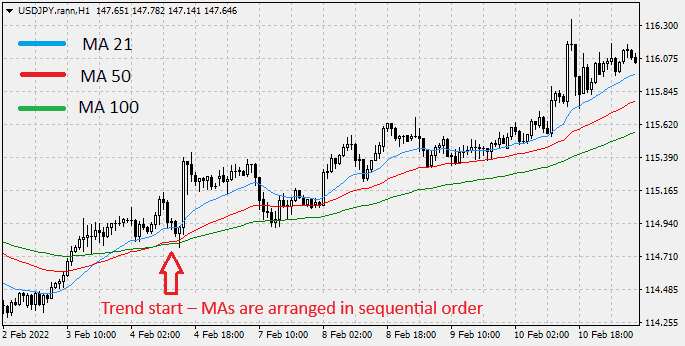
A common way to identify a trend is by using indicators. There are many indicators used for trend identification, such as Alligator, Parabolic SAR, Ichimoku, ADX, and others, but the most commonly used are moving averages (MA).Typically, several moving averages with periods are used to identify a trend, for example, 21, 50, and 100. They can have completely different periods, and each trader uses their own preferred settings.
The trend is considered valid if the moving averages on the chart are arranged in sequential order, do not intersect with each other, and are sloping in the direction of the trend.
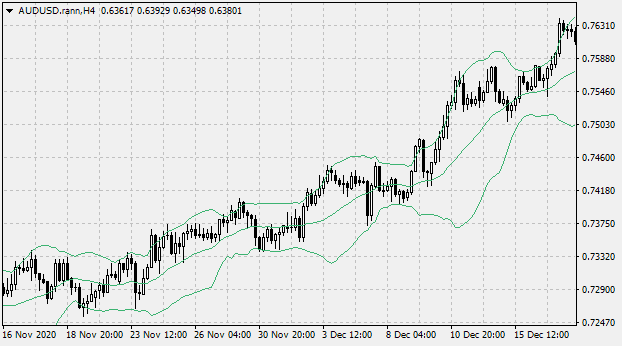
Another popular indicator is the Bollinger Bands, which essentially consist of three moving averages with specific parameters that form a channel. This indicator allows for a fairly accurate identification of the trend while also helping to assess market volatility. The bands widen when volatility increases and contract when volatility decreases, making it easy to visualize changes in market conditions.
How to Trade a Trend
There are several ways to trade with a trend:- Entering without any analysis
- Entering after a correction
- Entering within a correction
- Entering from levels
Entering Without Any Analysis
Using your own methods, you analyze the chart and determine that a trend is present, then open a trade in the direction of the trend — if the trend is upward, you buy; if the trend is downward, you sell. In this approach, you do not look for an optimal entry point; it is sufficient that the trend exists. In my opinion, this is a rather controversial trading method.
Entering After a Correction
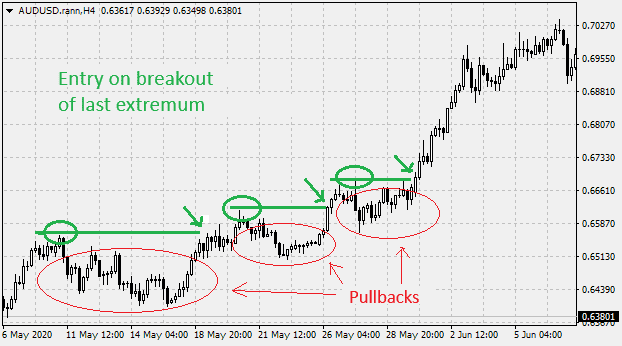
After identifying a trend, you wait for a correction to occur. Once the correction ends and the price resumes moving in the direction of the trend, you enter the market. The entry is typically made when the price breaks the most recent swing high or low in the direction of the trend.
Entering Within a Correction
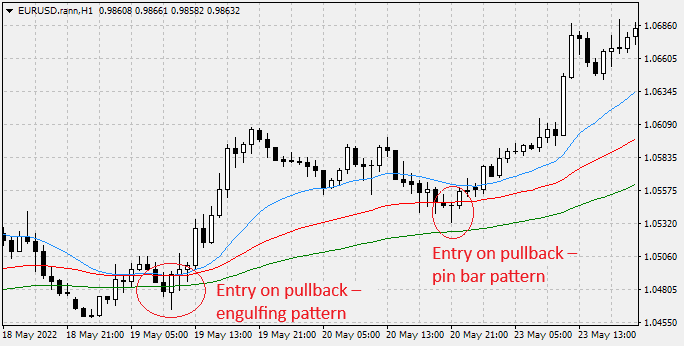
After identifying a trend on the chart, you wait for the price to start a correction (as in the previous case), but you look for an entry directly within the correction. In other words, you look for a reversal of the corrective movement in order to open a trade in the direction of the main trend. Candlestick formations and price action patterns can be used for entry.
Entering from Levels
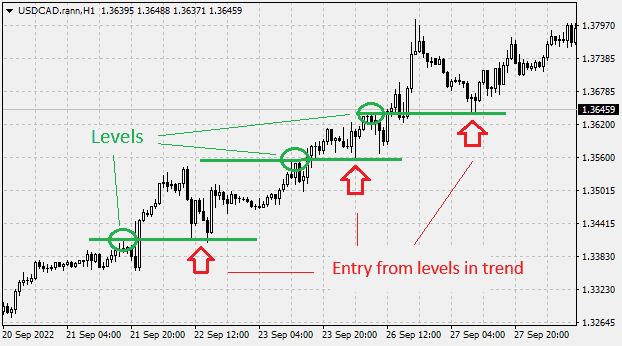
For trading with the trend, support and resistance levels are used. During subsequent corrections, as the price returns to these levels, it can be assumed that the price will attempt to bounce off them. In this case, you can look for an entry when the price touches a level or when a reversal setup forms at that level.
How to Trade a Trend Across Multiple Timeframes
The trend trading methods described above have their advantages and disadvantages. Next, we will consider an approach using multiple timeframes. The idea is to identify a trend on a higher timeframe and then switch to a lower timeframe to look for an entry. In this case, a small stop loss is placed on a lower timeframe, while take profit is set on a higher timeframe. This approach allows you to reduce stop loss and significantly improve the risk-to-reward ratio.Let’s consider examples.
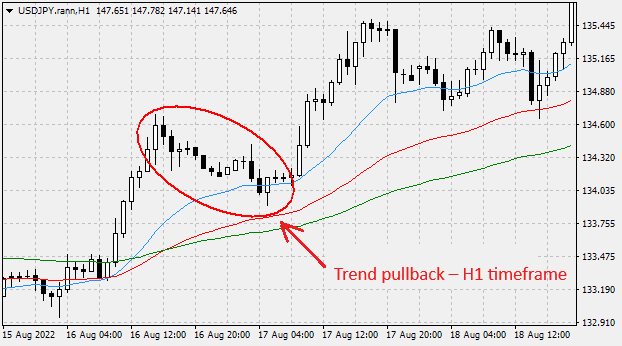
For example, you see the trend on the H1 (one-hour) timeframe, wait for the correction, and then switch to the M15 (15-minute) timeframe. On the M15, you look for an entry within the correction in the direction of the trend on the H1. The stop loss is placed on the M15, while the take profit is set on the H1.
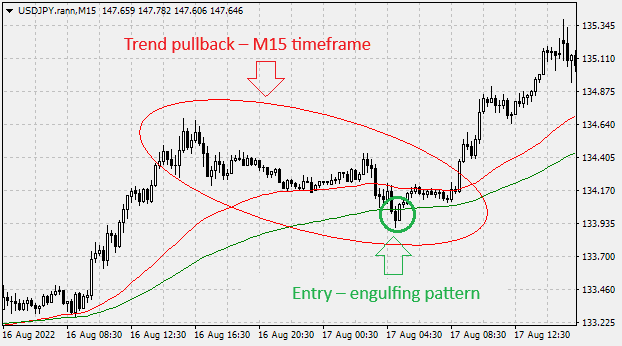
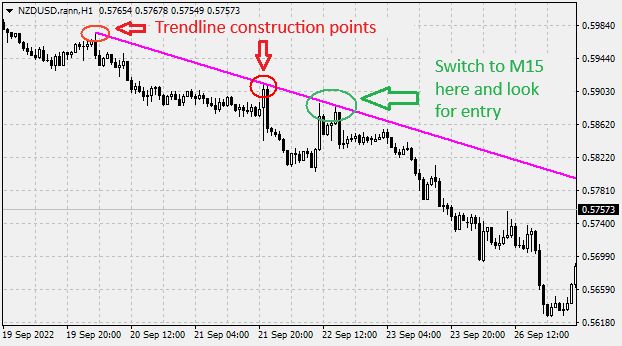
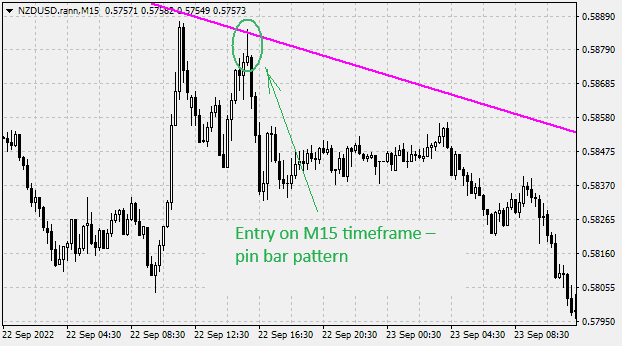
Another example. On the H1 timeframe, you see the trend and wait for the correction to begin. As the price approaches the trendline, you plan to open a trade. For this, you switch to the M15 timeframe and look for an entry there. The stop loss is also placed on the M15, while the take profit is set on the H1.
- ✅ 123 Pattern
- ⚡ Double Top and Double Bottom
- 🌐 Head and Shoulders
- 📜 False and True Breakouts
- 👍 Sideways Market





 Reviews:
 Reviews:
 Reviews:
 Reviews: