Trend Lines
Trend lines in trading are a basic tool for trend analysis on a price chart. They are drawn for a bullish trend using the extremes of the lower boundary of price movement, and for a bearish trend using the extremes of the upper boundary of price movement.Contents:
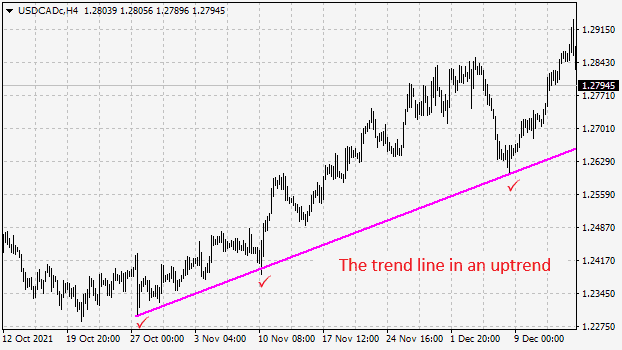
A trend line helps visually identify the direction of price movement in the market. If the price remains above an ascending trend line, the trend can be considered bullish. If the price stays below a descending trend line, the trend is considered bearish.


How Trend Lines Are Drawn
Let’s take a closer look at how trend lines are drawn in both rising and falling markets.The trend line in an uptrending market.
The trend line in a downtrending market.
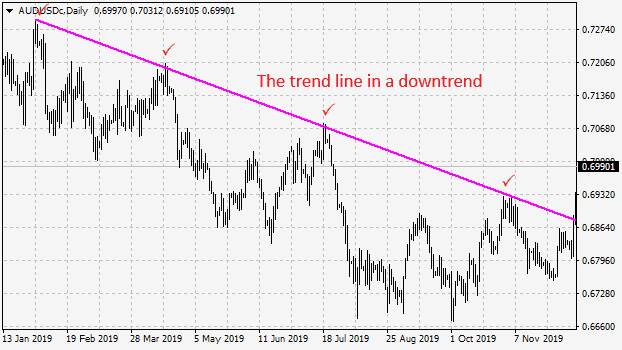
It is rare that a single trend line drawn at the beginning of a directional movement is sufficient. Since the trend can—and most likely will—expand, contract, change its angle, or move beyond the line, all of these nuances need to be taken into account. The current trend line should be adjusted as necessary, and new lines added when appropriate.
How to Trade Using Trend Lines
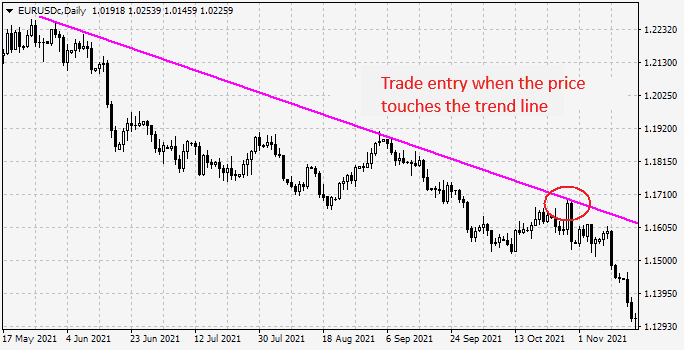
Trend lines can be traded either on a rebound or on a breakout, provided the trader has sufficient experience.Rebound From the Trend Line
Trading on a rebound occurs when the price returns to the trend line. Each trader determines the entry point independently, based on their experience and professionalism.Trade entry when the price touches the trend line.
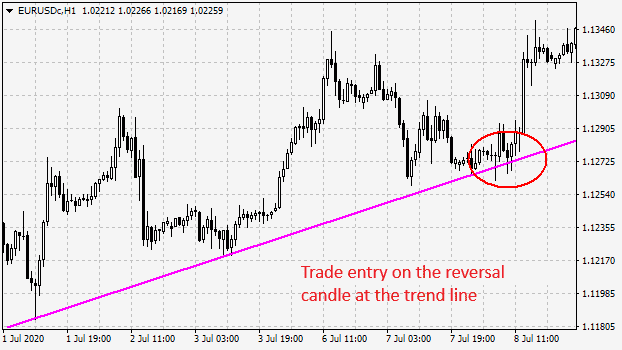
More conservative traders wait for the price to react to the trend line and for a corresponding signal. Most often, such a signal is a reversal pattern.
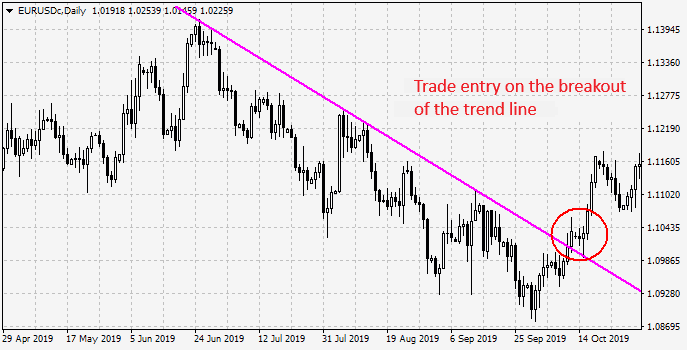
Breakout of the Trend Line
When trading a breakout, it is important to wait for the breakout to occur and assess its strength to determine whether the price movement is likely to continue in the direction of the breakout before entering a trade.
- ✅ Pin Bar, Hammer, Shooting Star
- ⚡ Outside and Inside Bars
- 🌐 Railroad Tracks and Tweezer
- 📜 Support and Resistance Levels





 Reviews:
 Reviews:
 Reviews:
 Reviews: