Double Top and Double Bottom
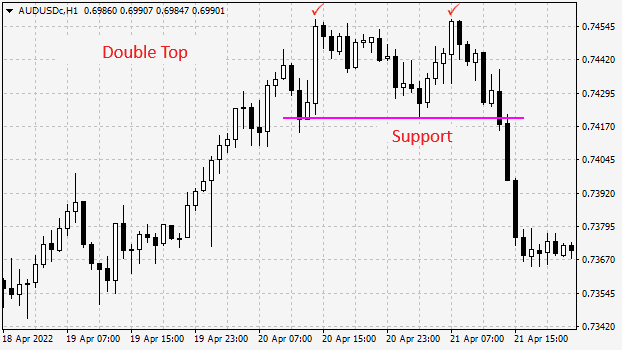
The double top and the double bottom are classic reversal patterns in technical analysis. The double top typically forms after a sustained uptrend and signals a potential bearish reversal. In contrast, the double bottom represents the mirror image of the double top and develops after a prolonged downtrend, indicating a possible bullish reversal.The double top pattern consists of two consecutive peaks formed at the end of a bullish move. The highs of these peaks are located at approximately the same level, although an exact match should not be expected. The support level in this formation is the low between the two peaks.


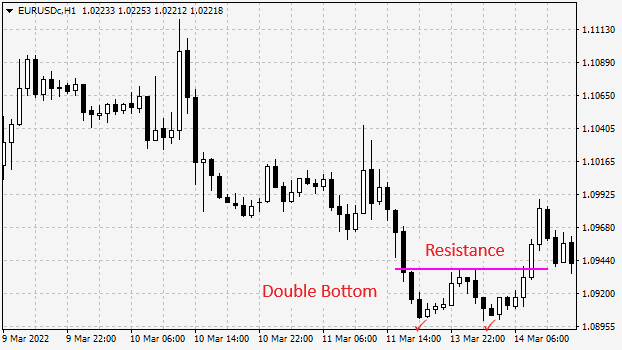
The double bottom pattern appears as two consecutive troughs formed at the end of a bearish move. The high between the two troughs is the resistance level.
How to Trade the Double Top and the Double Bottom
Since these are reversal patterns, they are typically traded in anticipation of a trend reversal at the end of which they form.There are various approaches to entering a trade, but here we will demonstrate the most conservative trading method.
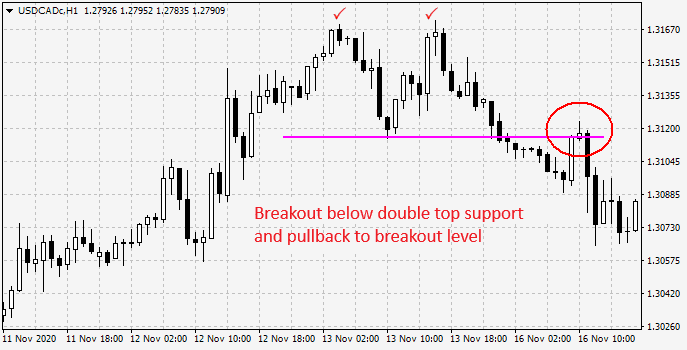
For the double top, trades are executed when the low (support level) between the two peaks is broken. Entries can be made either at the moment of the breakout or after the pullback to the breakout level.
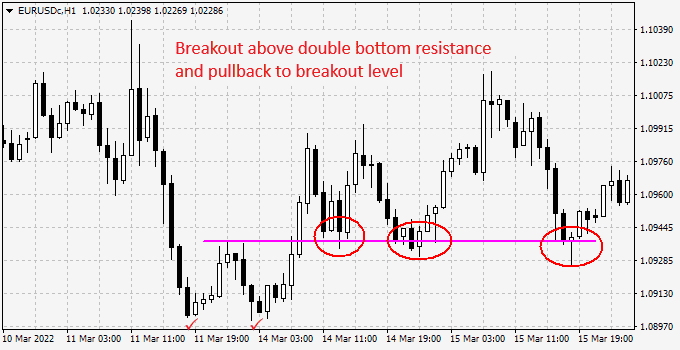
For the double bottom, trades are executed when the high (resistance level) between the two troughs is broken. Entries can be made either at the moment of the breakout or after the pullback to the breakout level.





 Reviews:
 Reviews:
 Reviews:
 Reviews: