Sideways Market in Forex and the Stock Market
Most traders in Forex and the stock market prefer to trade with the trend. However, in reality, the market spends most of its time in a sideways market, which is often referred to as a range-bound market, consolidation, or flat market.Contents:


What Is a Sideways Market
If a trend is a directional movement of price up or down, a sideways market is a price movement within a horizontal range.
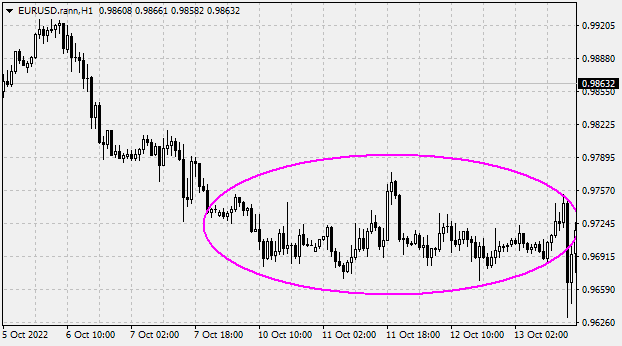
The main reasons a sideways market forms include:
- The market is squeezed between significant levels.
- Low liquidity in stock trading or during Forex sessions.
- The market is waiting for important economic or political news.
- Reduced trading volume on pre-holiday days.
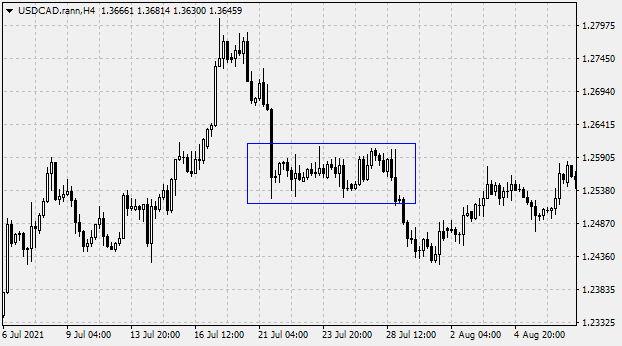
A Narrow Sideways Market
A narrow sideways market usually forms when liquidity is low. Often, it occurs in anticipation of major market news, creating significant uncertainty among traders and a lack of trading activity. In such cases, trading volumes in the sideways market are very low.
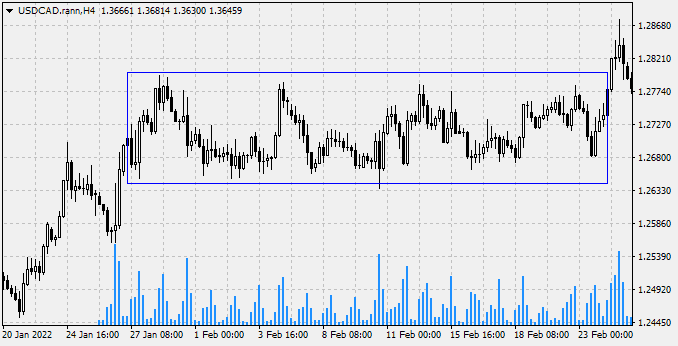
A Wide Sideways Market
A wide sideways market usually forms between key levels. On the candles located at the boundaries of the wide sideways market, higher trading volumes can be observed, indicating the presence of a major market participant operating at the edges of the market range.
How to Identify a Sideways Market
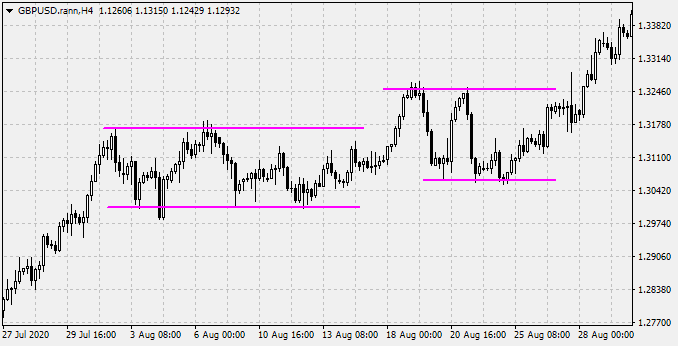
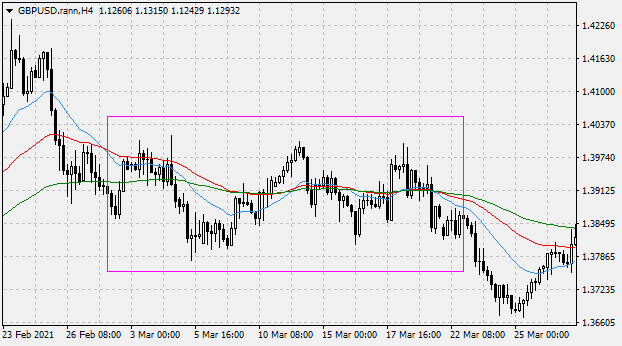
A sideways market can be identified visually, on the chart, when the price moves within a horizontal price range. Levels should be drawn at the highs and lows of the sideways market to mark the range in which the market moves. The range can expand, in which case new levels should be added.
Indicators can also be used to determine that the market is in a sideways market.
For example, several moving averages of different periods will intertwine during the sideways market.
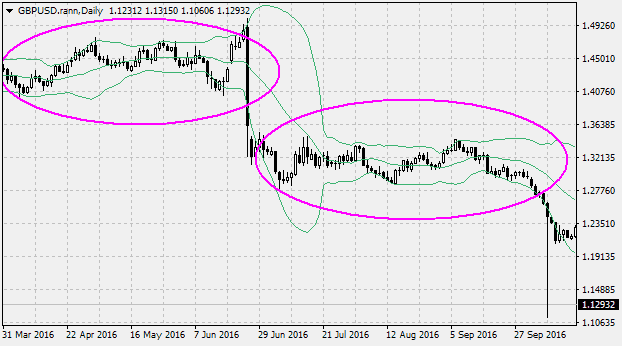
Also, Bollinger Bands will contract into the horizontal channel when the sideways market begins.
How to Trade in a Sideways Market
It is not recommended to trade in a narrow sideways market with low liquidity. It is better to wait for the price to break out of the consolidation before entering a trade.
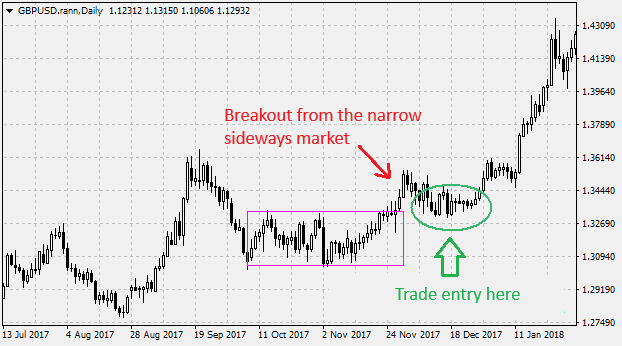
In a wide sideways market, trading is possible both from the boundaries inward and on a breakout of the consolidation in the direction of the price movement.
When trading from the boundaries inward, a trade should be considered when the price approaches a boundary line of the sideways market. Various reversal candlestick patterns can be used for entries.
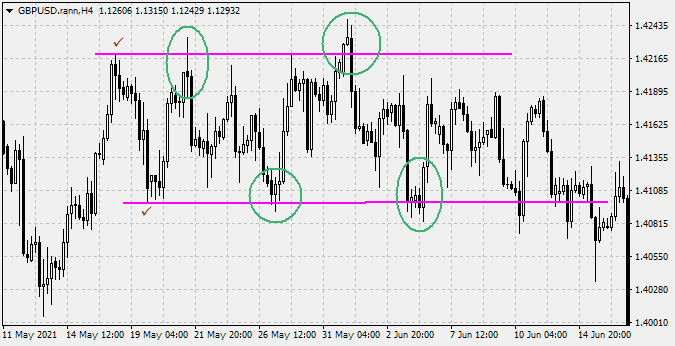
If the boundary of the sideways market is broken, it is better to wait for the price to return to the consolidation from the outer side before entering a trade. Various candlestick patterns and price action models are suitable for trade entries.
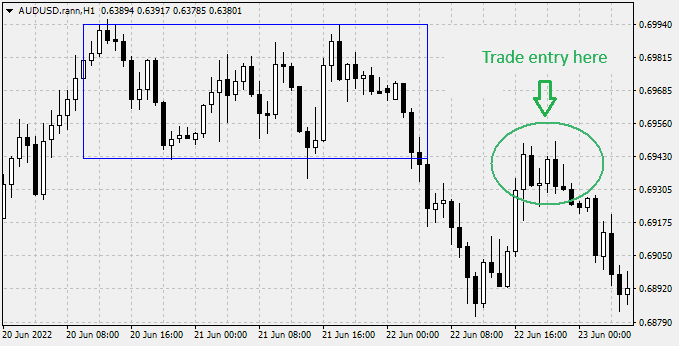
How to Trade Using Multiple Timeframes
To reduce stop loss size and improve trade quality, one can trade in a sideways market using multiple timeframes.For example, the sideways market forms on M30 (30-minute timeframe). When the price approaches a boundary of the consolidation, switch to a lower timeframe, such as M5. On M5, you have far more opportunities to enter a trade with better precision. Candlestick patterns can be used for entries, for example — the engulfing pattern. Stop loss is set on the M5 timeframe, while take profit can be set at the opposite boundary of the sideways market on the M30 timeframe.
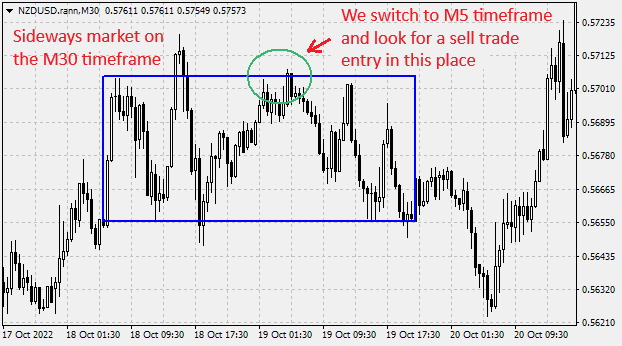
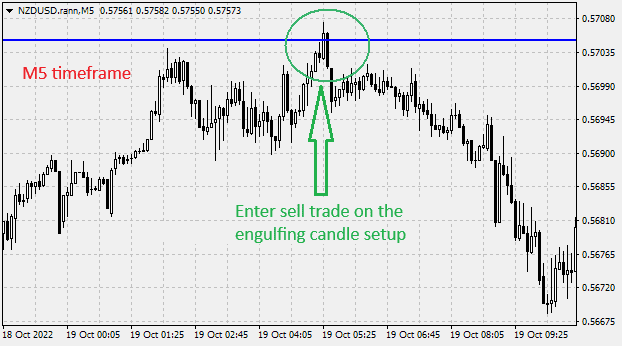
There can be various variations with take profits, stop losses, and timeframes, but the principle should be clear.
- ✅ 123 Pattern
- ⚡ Double Top and Double Bottom
- 🌐 Head and Shoulders
- 📜 False and True Breakouts
- 💱 Trend





 Reviews:
 Reviews:
 Reviews:
 Reviews: