True and False Breakouts
A false breakout is one of the few situations where a trader can trade with large market players against the crowd. However, even when trading false breakouts, it is still possible to end up on the wrong side of the market.Contents:
A false breakout is a brief price movement beyond a level, followed by a rapid return of the price.


Why False Breakouts Happen
You should know the main unwritten law of the market and trading: one trader’s loss is another trader’s profit. That’s why false breakouts happen — to activate stop losses and pending orders placed beyond a level.Why activate stop losses and pending orders? When stop losses are activated, traders’ previously profitable trades are closed at a loss. Activating pending orders in the direction of the false breakout pushes traders into losing positions.
How a Proper False Breakout Looks
I follow these rules for identifying a false breakout.The candle forming the false breakout should pierce the level only with its shadow.
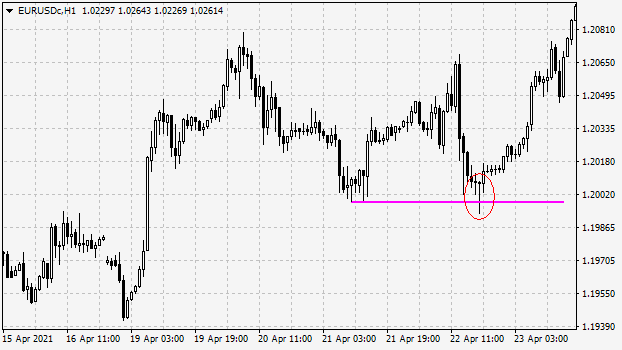
The candle forming the false breakout may close beyond the level, but in that case, the next candle should return the price back.
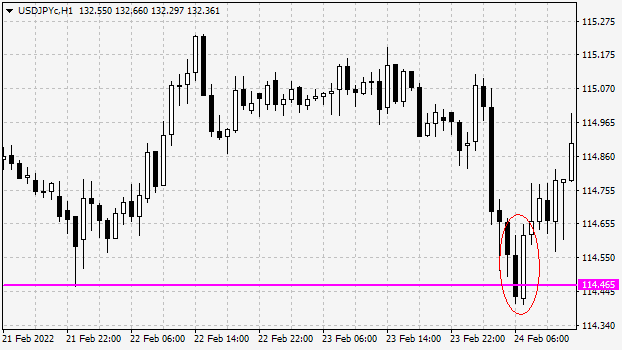
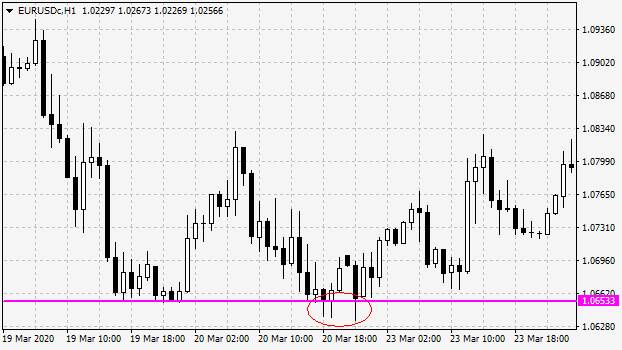
Ideally, a false breakout should be formed by one candle (maximum three). If more than three candles form the false breakout, it indicates that, on the current timeframe, the effectiveness of such a breakout may be questionable. You can try switching to a higher timeframe to assess the relevance of the level and the quality of the false breakout there.
How to Trade False Breakouts
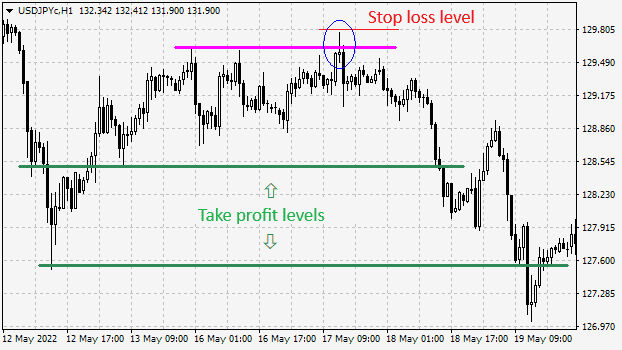
False breakouts should be traded only at horizontal levels. Entry is made when the candle that formed the false breakout is fully formed. If, after entering trade, the next candle hits your stop loss and creates the new false breakout, you can re-enter trade.
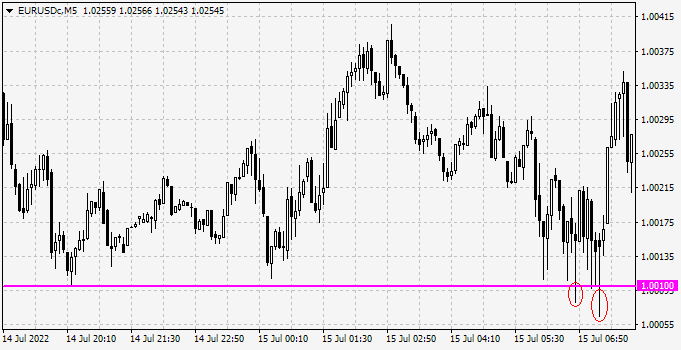
Take profit is set at the level (for example, support or resistance). Don’t expect a prolonged trend to follow every false breakout. The price movement may end at any nearby level.
The stop loss is placed at the end of the candle that formed the false breakout. If the stop loss is too large, you should either skip trade or reduce its size so that the monetary risk is acceptable for you.
True Breakout of a Level
A true breakout becomes obvious on a chart only in hindsight, after price has broken the level, moved away from it, and formed a new trend.The question is: how can you trade in a way that lets you enter a position well before the new movement after the breakout is fully formed?
There is only one relatively reliable approach to trading a true breakout, and we will go through it.
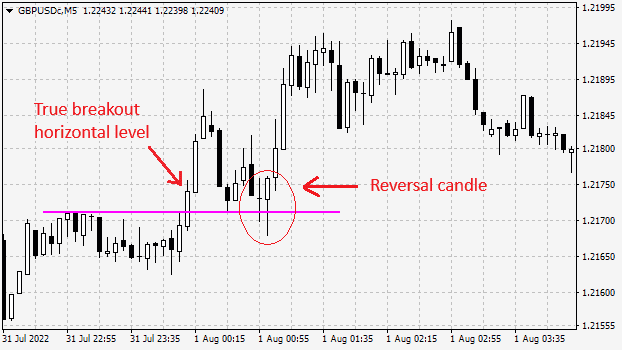
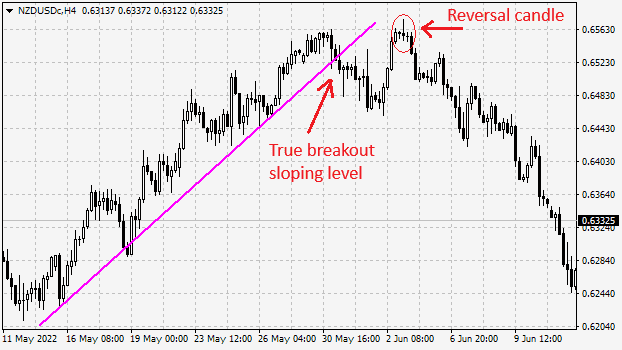
After a breakout of a level (horizontal or sloping), price usually begins to pull back toward the level. Trades can be entered using, for example, candlestick patterns when price shows a retracement. If price moves away from the level immediately after the breakout and does not return, it’s better to skip the trade. In such cases, avoid chasing price until a corrective movement develops within the new trend.
Examples on Charts
Breakout of the horizontal level, the pullback to the level, entry on the reversal candle.
Breakout of the sloping level, the pullback to the level, entry on the reversal candle.





 Reviews:
 Reviews:
 Reviews:
 Reviews: