Flag and Pennant Patterns
Flag and pennant patterns are considered trend continuation formations. They usually develop during pullbacks after a directional price move. In most cases, these patterns are relatively small. However, during prolonged corrections, they can expand significantly in size.Let’s take a closer look at what these patterns are and how they appear on price charts.
Contents:


Flag Pattern
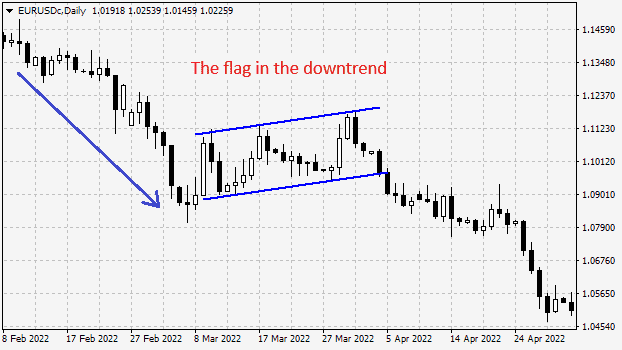
Flag pattern forms during a correction and looks like a channel or rectangle. A key feature is that a flag should be tilted against a trend or at least remain horizontal. Essentially, a flag is a small parallel channel formed within a trend.The flag pattern in the downtrend.
Pennant Pattern
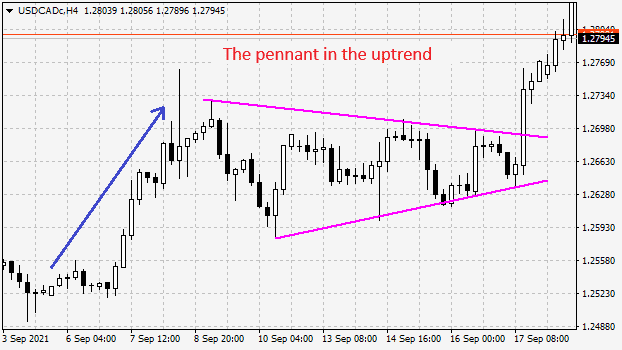
Pennant pattern (also called a wedge) forms, like the flag, within a price movement or impulse and represents a correction of that movement. A pennant appears as a converging triangle.The pennant pattern in the uptrend.
How to Trade Flag and Pennant Patterns
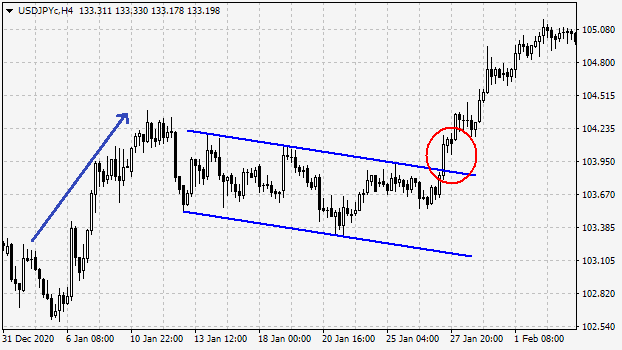
Since flag and pennant patterns are considered corrective formations within a primary price movement, they are usually traded in direction of a current trend. However, keep in mind that any correction can potentially turn into a trend reversal.When trading the flag, the tactic is to enter a trade when the price breaks the flag’s boundary, in the direction of the trend.
For trading the pennant, the signal to enter a trade is the price breaking the pennant’s boundary.
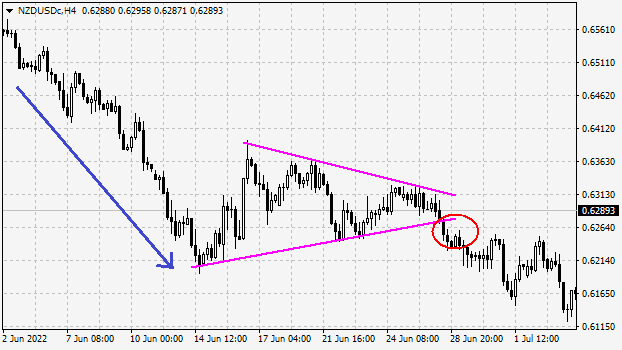
When trading these patterns, you don’t have to enter immediately at the breakout; you can wait for a pullback to the outer side of the pattern’s boundary before opening a trade.
Related Posts:
Comments


Ponch 2026-02-13 10:48:00 #
Flag and pennant patterns are very good. The key is not to mistake every channel for a flag or every converging triangle for a pennant. There must first be a trending movement, and only at its end should a flag or pennant form, which I trade as a correction. If the correction fails to confirm, I usually take 1-2 small stop-losses, the trend resumes, and I then wait for the next flag or pennant.



 Reviews:
 Reviews:
 Reviews:
 Reviews: