Rectangle Pattern
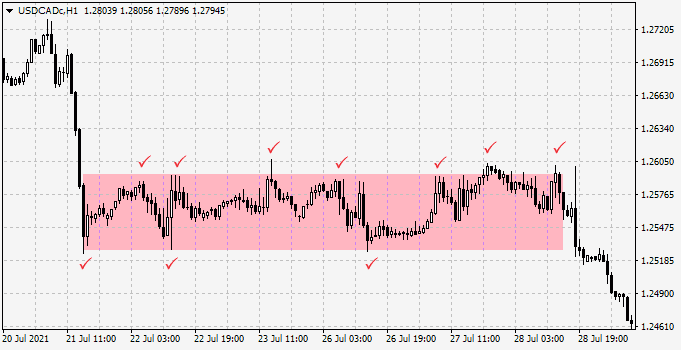
The rectangle pattern forms as a horizontal price consolidation. It can appear on any timeframe. Visually, it resembles a horizontal equidistant channel, but in essence, it represents a price range between support and resistance. Unlike a channel, which is drawn using consecutive highs and lows, the rectangle pattern does not require a sequence of extrema.In the rectangle pattern, some candles may slightly fail to reach or may slightly break beyond its horizontal boundaries — this is normal. When drawing the rectangle, it is preferable to define its upper and lower boundaries not by single candle extremes, but by the greatest number of price touches, even if this requires a slight adjustment inward, within reasonable limits.


How to Trade the Rectangle Pattern
The rectangle formation can appear either as a standalone structure or as part of a trending movement. This is an important point, because the trading approach will differ depending on the context. If the rectangle forms as a correction during a trend, it is generally preferable to trade it in the direction of the prevailing trend.
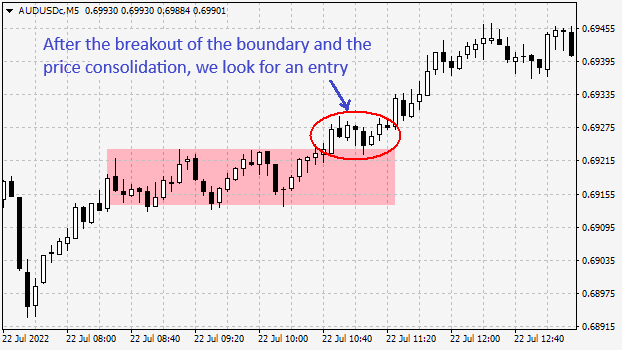
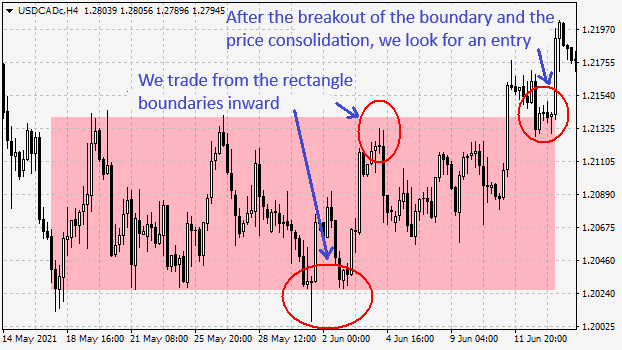
If the rectangle is wide, large in size, and not part of a clear trend, it is considered a standalone formation. In this case, it is possible to trade inside the rectangle, entering on bounces from its boundaries. When the price breaks the boundary and consolidates beyond it, opening a position in the direction of the breakout can be considered.
Related Posts:
Comments


Elon 2026-01-10 12:32:26 #
The rectangle pattern is basically a regular flat, or a consolidation - whichever term you prefer. I mark rectangles on higher timeframes (usually H4), and for trading I switch to lower timeframes (M15, occasionally M5). I don’t like marking levels, constantly adjusting them, adding or removing. With rectangles it’s simpler - I look at my working currency pairs, mark consolidations (only those the price hasn’t broken yet), switch to a lower timeframe, and trade inside the rectangle from boundary to boundary. But I always keep in mind that the price will eventually break out of the consolidation. The nuances - where to enter, where to exit, etc. - you’ll learn with experience.



 Reviews:
 Reviews:
 Reviews:
 Reviews: