Pin Bar, Hammer, Shooting Star
Pin bar, hammer, and shooting star are among the most popular candlestick patterns used by traders. These patterns are very similar and share a similar meaning.The term "pin bar" comes from price action, while the hammer and shooting star originate from classical candlestick analysis. Visually, however, they look almost identical.
Contents:


Pin Bar Pattern
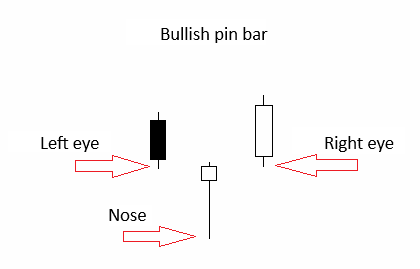
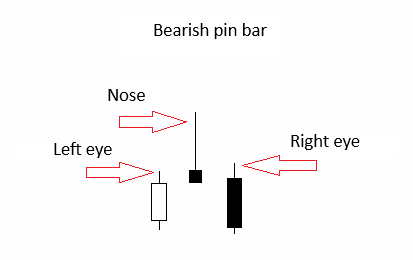
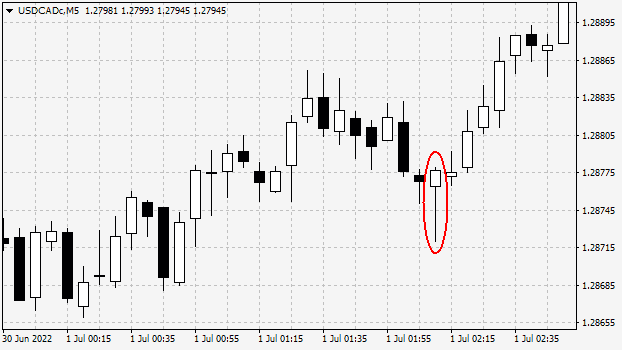
The pin bar gets its name from the fairy-tale character Pinocchio, due to its long nose. A pin bar consists of a small candle (or bar) body and a long tail pointing against the current price movement. In most cases, the pin bar is a reversal pattern. The distinctive feature of this formation is that the tail should be at least 3–4 times the size of the candle body.Unlike the hammer and shooting star, the pin bar setup consists of three candles: the left candle represents the left eye, the middle candle with the long tail is the nose, and the right candle is the right eye.
Shooting Star and Hammer Patterns
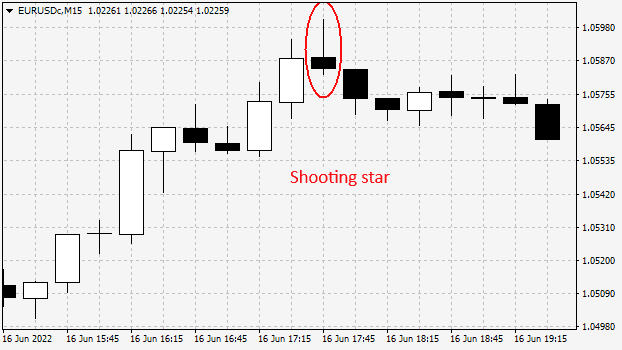
The shooting star pattern usually appears at the end of an upward movement and indicates a bearish reversal. Its small candle body and long upper shadow indicate that buyers are losing strength.
The hammer pattern appears at the end of a downward movement and indicates a bullish reversal. Its small candle body and long lower shadow show that sellers are losing control and buyers are stepping in.
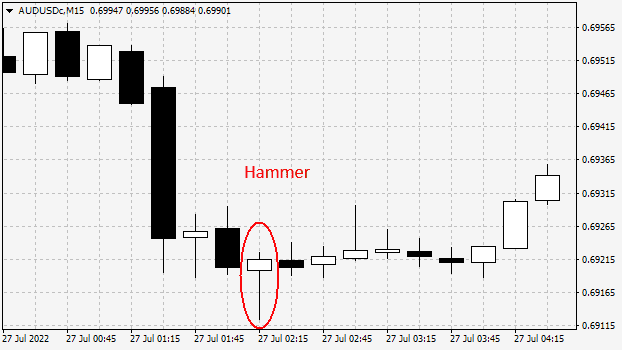
Unlike the pin bar, these patterns consist of a single candle with a small body and a long tail, which is at least 2–3 times the size of the candle body. Visually, they look almost identical to the pin bar. Ideally, the shooting star should have a bearish body, while the hammer should have a bullish body.
Doji Pattern
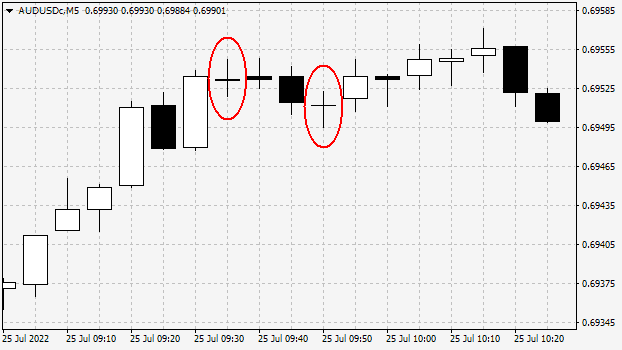
The doji differs from the patterns described above in that the candle’s closing price is equal to or very close to its opening price. The tail can be on one side or on both sides. A doji with a single tail can serve as a reversal pattern, provided that the tail points against the current price movement.
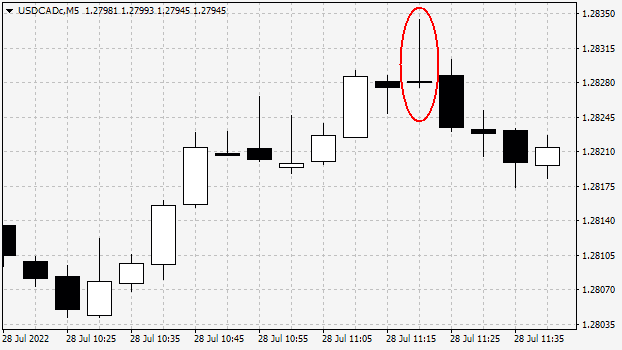
Doji with two tails more often signal market indecision rather than a reversal. These types of doji are often called neutral, rickshaw, or star, depending on the length of the tails.
How to Trade the Pin Bar
In this section, I will describe ways to trade the pin bar pattern, although these methods can also be applied to the shooting star and hammer.Trading pin bars in narrow price ranges is generally not recommended, as a reversal pattern should be preceded by some price movement.
A common mistake among traders is entering a trade immediately upon spotting a reversal pattern. This approach is almost always unprofitable. The pin bar should be treated as a confirmation signal, not the primary signal.
Pin bars should be analyzed, for example, at key price levels, channel boundaries, Fibonacci levels, etc. They work particularly well at the end of a correction, signaling a possible continuation of the trend.
A trade should be entered only after the pin bar has fully formed. The stop loss is usually placed beyond the tail of the candle. The take profit level depends on the trader’s strategy: when trading channels, it is set at the opposite channel boundary; when trading levels, it is set at the next level.
Let’s look at some options for trading a reversal bar.
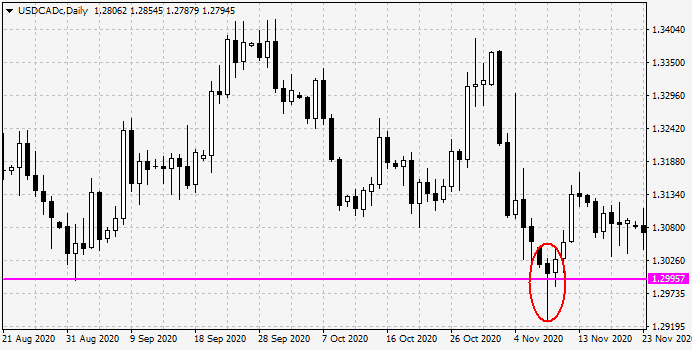
Pin Bar at the Level
When the price approaches the key level, a trade can be opened once the pin bar has fully formed.
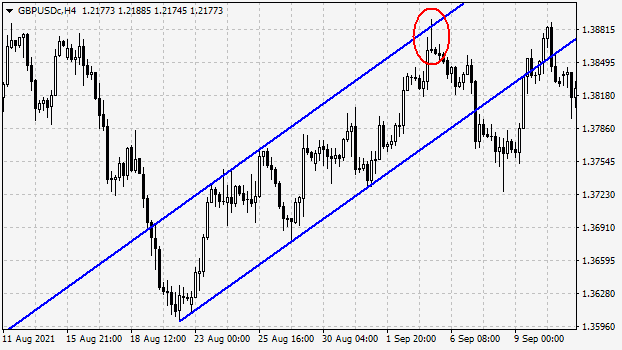
Pin Bar at the Channel Boundary
When the price approaches the boundary of the channel, a trade can be opened once the pin bar has fully formed.
Pin Bar in the Correction
In this case, we trade the pin bar in the direction of the trend, but wait for it to form at the end of the correction in the direction of the main movement.
Multi-Timeframe Trading
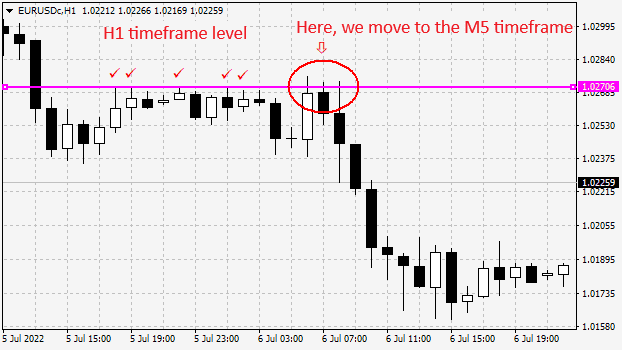
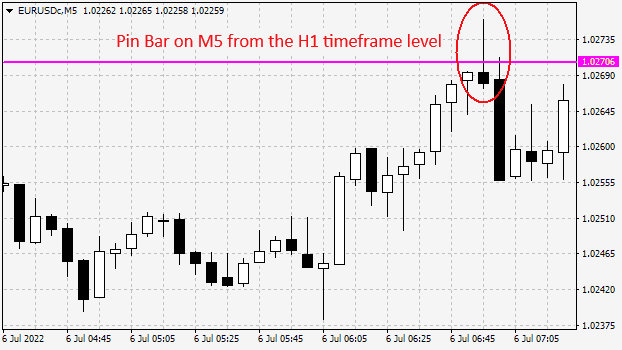
You can also draw levels, channels, etc., on higher timeframes, and when the price approaches a potential reversal zone, switch to a lower timeframe and wait for a pin bar to form there.
In Conclusion
We have reviewed just a few ways to trade. It is crucial to understand that a pin bar should always be used in conjunction with a method that helps the trader forecast market direction and potential reversals. The pin bar itself acts only as a trigger for entering a trade.
- ⚡ Outside and Inside Bars
- 🌐 Railroad Tracks and Tweezer
- 📜 Support and Resistance Levels
- 💱 Trend Lines





 Reviews:
 Reviews:
 Reviews:
 Reviews: