


Japanese Candlesticks and Bars
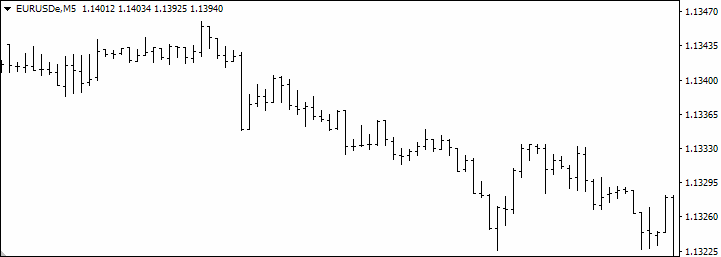
Price on charts can be displayed in various ways. Modern trading platforms offer several types of price visualization and allow traders to switch between them with a single click. Each trader chooses the chart type that suits them best. There are quite a few options, but we will focus on the most common ones: Japanese candlesticks, bar charts, and line charts.What is OHLC
Candlesticks and bars share the same structure — OHLC, which stands for four key price parameters used in these charts:


- O (Open) – the opening price
- H (High) – the highest price
- L (Low) – the lowest price
- C (Close) – the closing price
Japanese Candlesticks (Candlestick Chart)
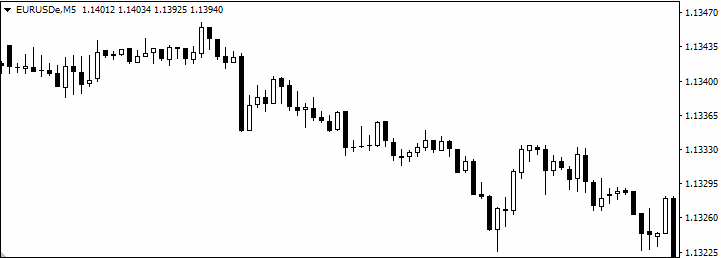
Japanese candlesticks are the most common way to display price on a chart. They are visually easy to interpret. Many patterns and trading strategies are based on candlesticks. Depending on the price movement, a candlestick can be bullish, bearish, or neutral.
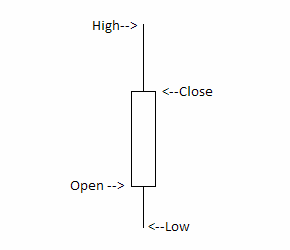
Structure of a Candlestick
A candlestick consists of a body and wicks and has four price parameters:- Open – the opening price
- High – the highest price
- Low – the lowest price
- Close – the closing price
In some cases, a candlestick may have fewer price parameters, as the high or low can coincide with the open or close. The open and close prices are always present, but one or both wicks may be absent.
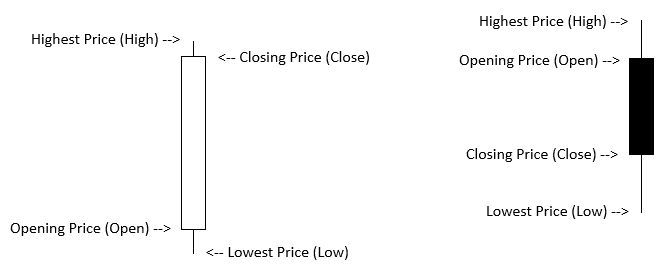
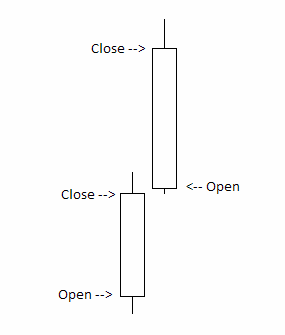
Bullish Candlestick
A bullish candlestick indicates a price increase, with the close higher than the open. A bullish candlestick may have two wicks, one wick, or no wicks at all.
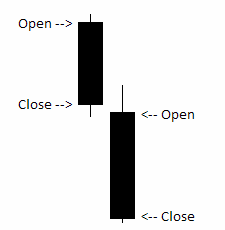
Bearish Candlestick
A bearish candlestick indicates a price decrease, with the close lower than the open. A bearish candlestick may have two wicks, one wick, or no wicks at all.
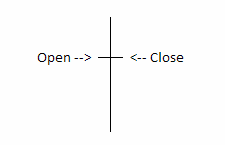
Neutral Candlestick
A neutral candlestick has no direction, with the closing price equal to the opening price. It may have wicks or none.
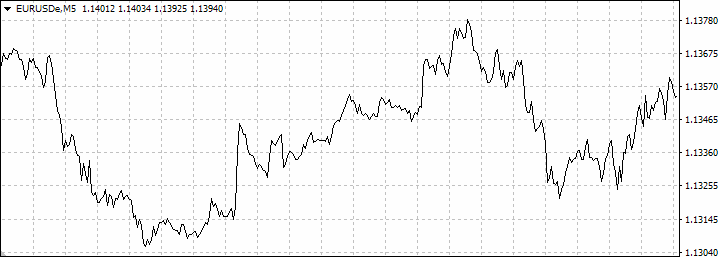
Bars (Bar Chart)
One of the widely used ways to display price on a chart is the bar chart. A bar chart has the same parameters as a candlestick chart, differing only in visual representation. Some traders prefer bars for their simplicity and uncluttered appearance, while others find them harder to interpret—especially if they are used to Japanese candlesticks.
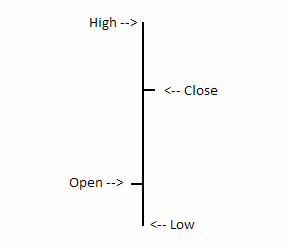
Structure of a Bar
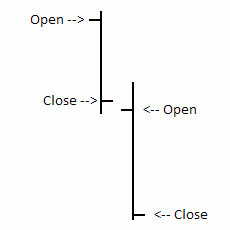
A bar is represented by a vertical line that visually displays the same price parameters as a candlestick:- Open – the opening price
- High – the highest price
- Low – the lowest price
- Close – the closing price
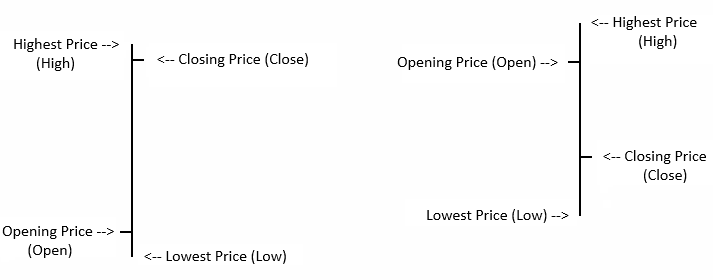
As with a candlestick, the bar’s high or low may sometimes coincide with the open or close price.
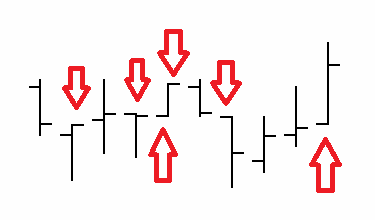
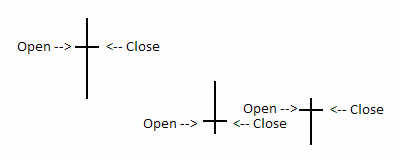
Bullish Bar
A bullish bar indicates a price increase and has the closing price higher than the opening price.
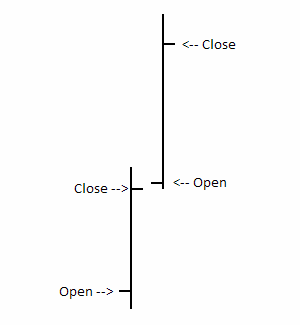
Bearish Bar
A bearish bar indicates a price decrease and has the closing price lower than the opening price.
Neutral Bar
A neutral bar has no direction, as its closing price is the same as its opening price.
Line Chart
A line chart displays price as a line constructed from the closing prices. In some platforms, a line chart can also be built using opening prices, highs, lows, or the median price. However, it is generally considered a less informative way to visualize price on a chart. Line charts can be useful for traders who want to see only the overall trend of an asset over longer timeframes, but they are rarely used for active trading.
Comments


Marine 2025-06-02 00:26:42 #
Candlesticks and bars are basically the same. The only difference is that candlesticks have fully drawn bodies, while bars only show the top and bottom. Some traders think they display different information, but that’s not true.

GEN 2025-10-18 08:09:44 #
In some books and on old charts, I’ve seen bars that only show the high, low, and close — the open price is missing. That is, the bar looked like a vertical line with only the closing price marked on the right side. Apparently, such bars did exist.


 Ru
Ru