


Tick Chart
In addition to the main and most common types of charts used in Forex — as well as in other financial markets — there is also the tick chart. This type of chart is not the most convenient for trading, but there are traders who make use of it.A tick chart is built based on ticks, as its name suggests. Therefore, before studying it in detail, let’s first understand what ticks are.
In this article, we’ll examine tick charts in the context of the Forex market, but the underlying principles are exactly the same for other markets and financial instruments as well.
What Are Ticks
A tick is any single change in a price quote that occurs as a result of a trade being executed in the market. Even if a trade takes place at the same price as the previous one — meaning the price hasn’t actually moved — it still counts as a tick.Ticks do not take into account the trade volume or the time between trades; only the very fact that a transaction has occurred matters.


How a Tick Chart Is Built
A tick chart is very similar to a regular line chart, but it is not tied to a time scale, although a time axis can be added for informational purposes. A tick chart is constructed solely based on changes in price.If a price quote arrives at the terminal at the same level as the previous one, the chart extends forward with a horizontal line. If the new quote is higher than the previous one, the chart moves upward; if it is lower, the chart moves downward. At all other times, the chart remains stationary, simply waiting for the next quote, regardless of how much time passes.
In many trading platforms, such as Thinkorswim (TOS) and others, it is possible to configure a tick chart so that it does not display individual ticks, but instead shows a set number of ticks per candle (or bar). In this case, a candle closes not based on time, but only when it accumulates a certain number of ticks (for example: 20, 50, 140, etc.).
From my personal experience, I can say that this is a very convenient feature — it’s a pity that it is not implemented in MT4 or MT5.
Tick Chart in MT4
The tick chart in MT4 is quite impractical. As a rule, it is used only when opening a trade, to achieve a more precise entry.
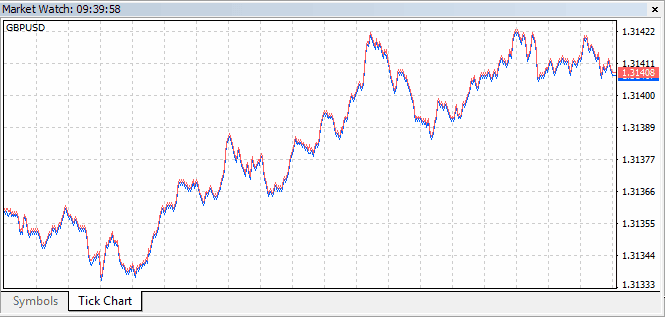
The chart can be built based on Bid or Ask prices. To open a tick chart in MT4, follow this path: "View" → "Market Watch" → "Symbols" → "Tick Chart".
Tick Chart in MT5
The tick chart in MT5 is almost identical to its predecessor in MT4. The only difference is the presence of a time scale. Otherwise, it remains just as impractical.
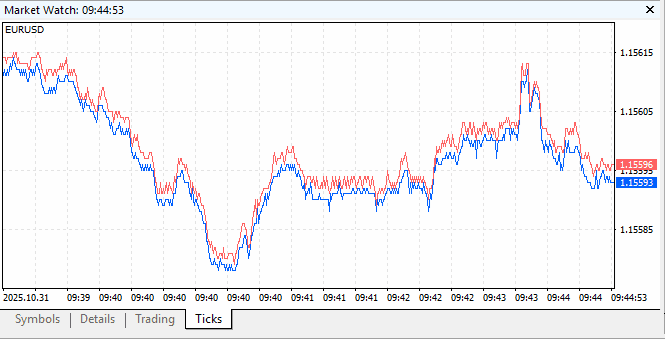
In MT5, the tick chart is located along the following path: "View" → "Market Watch" → "Symbols" → "Ticks".
If you need a more advanced tick chart functionality in MT4 or MT5, you will have to install an additional third-party indicator. This indicator will process ticks and display a tick chart in a separate window, where you can add indicators.


 Ru
Ru