Fractal Levels — Indicator for Drawing Levels
The Fractal Levels indicator is designed to automatically draw support and resistance levels on charts in the MetaTrader 4 terminal. The indicator uses a simple algorithm for drawing levels and can be useful for traders who use support and resistance levels in their trading. In this article, we will take a closer look at the indicator.How the Fractal Levels Indicator Works
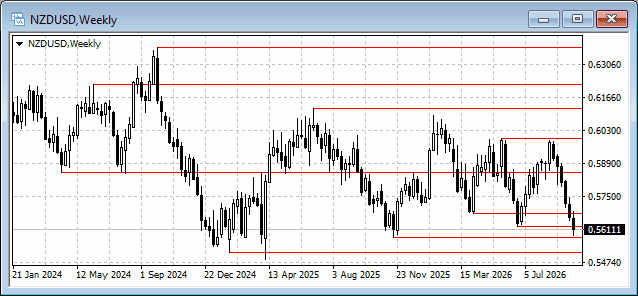
Fractal Levels automatically identifies local highs and lows on the chart and uses them to draw horizontal support and resistance levels. To identify these points, the indicator uses the specified number of bars to the left and right of the candle being analyzed. If the candle meets the required conditions, the indicator creates a level at the corresponding price.


When drawing new levels, the indicator can take into account existing levels located nearby. In the settings, the trader can choose whether to allow the creation of closely spaced levels or prevent them. The TouchTolerancePoints parameter is used to prevent duplicate levels and defines the allowed distance between a new level and an existing one.
The indicator analyzes the specified number of historical bars and displays the identified levels directly on the chart. The drawn levels can be used as reference points when analyzing price movements and looking for potential support and resistance zones.
Parameters and Settings
Fractal Levels has several parameters that allow traders to configure the level detection algorithm and how the levels are displayed on the chart. The settings allow you to define the depth of historical data analyzed, the conditions for identifying local highs and lows, the rules for creating closely spaced levels, and the appearance of the lines.
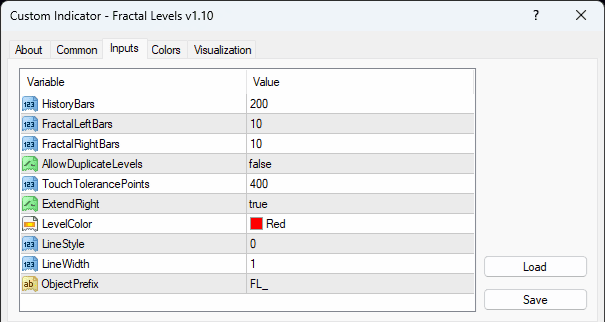
- HistoryBars — the number of historical bars that the indicator analyzes to find levels. The higher the value, the longer the historical period used to draw the levels.
- FractalLeftBars — the number of bars to the left of the candle being analyzed that are used to identify a local high or low.
- FractalRightBars — the number of bars to the right of the candle being analyzed that are used to identify a local high or low. Together with the FractalLeftBars parameter, this value determines the conditions under which a candle's high or low will be considered a significant local extremum.
- AllowDuplicateLevels — allows or prevents the creation of closely spaced (or identical) levels. If set to false, the indicator will not create a new level if another level already exists nearby within the distance specified by the TouchTolerancePoints parameter. If set to true, each identified extremum will be displayed as a separate level, and the TouchTolerancePoints parameter is not used.
- TouchTolerancePoints — the maximum distance between levels (in points) at which they are considered identical. If two levels are less than the specified distance apart, the second level will not be created. This parameter works only when AllowDuplicateLevels = false, meaning that the creation of closely spaced levels is disabled.
Examples:
- TouchTolerancePoints = 10 — if a new level is within 10 points of an existing level, it will not be created. If the distance between the levels is 11 points or more, the new level will be created.
- TouchTolerancePoints = 0 — if a new level has exactly the same price as an existing level, it will not be created. If the distance between the levels is 1 point or more, the new level will be created.
- ExtendRight — determines whether the drawn levels are extended to the right on the chart.
- LevelColor — the color of the lines.
- LineStyle — the line style:
- 0 — solid line;
- 1 — dashed line;
- 2 — dotted line;
- 3 — dash-dot line;
- 4 — dash-two-dots line.
- LineWidth = 1 — the line width. The higher the value, the thicker the line.
- ObjectPrefix = FL_ — the service prefix used for the names of objects created by the indicator. It is used to distinguish Fractal Levels lines from other objects on the chart. Changing this value is not recommended.
Using the Indicator on the Chart
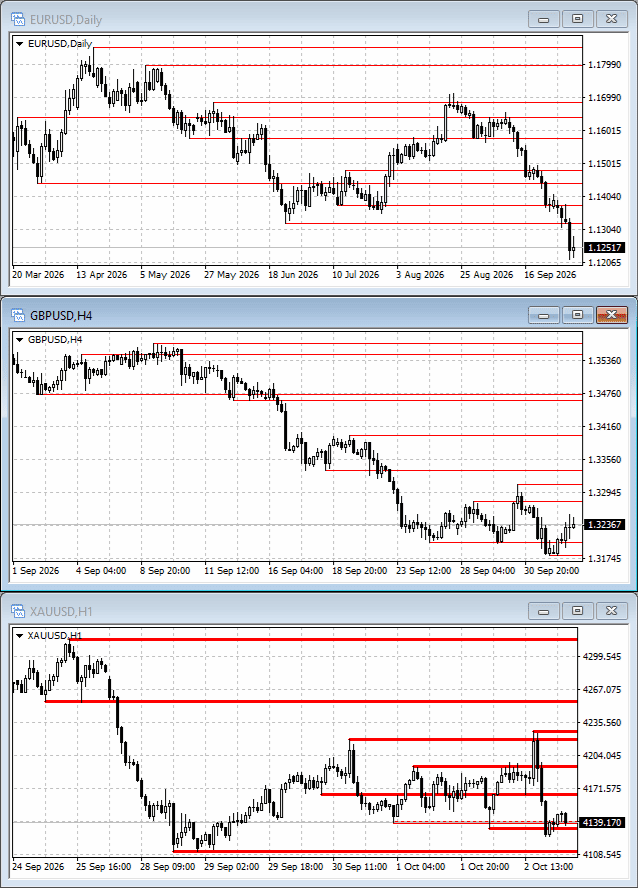
To use the indicator, attach it to a chart and configure the parameters according to your preferences. After installation and configuration, Fractal Levels automatically draws new levels as new bars form.The indicator does not delete levels after they are broken or when they no longer fall within the range of bars specified by the HistoryBars parameter. As new bars appear, previously created levels remain on the chart.
If you need to delete old levels that have moved beyond the range specified by the HistoryBars parameter, simply refresh the chart — for example, by switching the timeframe or reloading the chart profile. After that, the indicator will recalculate the data and draw levels only within the specified number of historical bars.
To delete all levels created by the indicator on the chart, remove the indicator from the chart. After the indicator is removed, all levels created by it will also be deleted.
Summary
Fractal Levels is a simple indicator for MetaTrader 4 designed to automatically draw support and resistance levels based on local price extremes. The indicator does not replace independent market analysis but serves as a convenient tool for automating the drawing of levels.The Fractal Levels indicator was developed by us, and the rights to it belong to our website. We offer it to our readers for free use.
- 👉 How to Install an Indicator in MT4, MT5
- ⚡ ClusterDelta – Real-Time Exchange Data for MetaTrader
- 📶 Volume Indicator
- 💱 Market Profile Indicator
- 📊 Delta and Cumulative Delta Indicator
- 💹 Footprint Indicator
- 🪙 SyncHLine – Copying and Synchronizing Levels Between Charts





 Reviews:
 Reviews:
 Reviews:
 Reviews: